Collecting Spring Repository metrics using Spring AOP
I have been working for quite sometime on optimizing API’s here at HomeLane. As we grow, it becomes crucial to make sure that our API’s have the lowest possible latency and are written in a performant way. The former depends on many factors, some being out of our control but the latter is in our very hands. In this post I discuss how I collected metrics for our Spring repositories to aid in optimization.
The Problem
We wanted to collect metrics, specifically latency and call counts for our ReactiveMongoRepository’s to help track and reduce the total no. of DB calls made by our business logic. We wanted to know exactly which CRUD operation were performed i.e which method of implementors of ReactiveMongoRepository was called. Mind you that even though we had an APM tool, it didn’t do that good of a job in this specific case. To begin, I leveraged MongoMetricsCommandListener using MongoClientSettingsBuilderCustomizer but the info was too detached i.e it lacked context. After searching, I was convinced that no such feature came bundled with Spring and so proceeded to implement it using AOP.
The idea was simple, intercept the Spring Repository calls and log metrics. For intercepting DB calls I leveraged Spring AOP. Since we work on a reactive stack, measuring the time at the start and end of the Spring Repo. method wasn’t enough. Instead we measure the start time when the advice is run and then later subtract it from the time measured at the first signal (emission of data or an error) . This was then wired with Micrometer using the MeterRegistry bean to log the metrics.
Implementation
The code is available at https://github.com/7-m/spring-repository-metrics.
We begin by declaring an aspect and declaring a pointcut. Here the pointcut matches any method (join point in AOP terminology) of an object that implements the ReactiveMongoRepository interface. We then use the @Around advice to capture the returning Flux/Mono of the join point and add behavior to it. The behavior being, logging the time at which the first signal emitted, be it an error or a successful emission. We also ensure that we do this just once by using a flag called first. Using the registry bean, the operation latency and the methods name is logged along with the outcome i.e a failure or success. This behavior is added to the stream using doOnEach(Consumer<? super Signal<T>> signalConsumer) which calls the supplied Consumer on every signal. The later part of the code calls the correct doOnEach() based on the return type i.e Flux/Mono.
Following is the code to configure the metrics recording aspect. Spring AOP and Spring Actuator are also needed so don’t forget to declare those dependencies in your pom.xml/build.gradle
@Aspect
@Component
@Slf4j
@RequiredArgsConstructor
public class DbMetricRecorderAspect {

  final MeterRegistry registry;

  @Pointcut(value = "target(org.springframework.data.mongodb.repository.ReactiveMongoRepository)")
  public void anyMongoRepositoryImplementor() {
  }

  @Around(value = "anyMongoRepositoryImplementor()")
  public Object doDbProfiling(ProceedingJoinPoint pjp) throws Throwable {
    Object ret = pjp.proceed(pjp.getArgs());

    String controller = pjp.getTarget().getClass().getInterfaces()[0].getName() + "." + pjp.getSignature().getName();

    final Long startTime = System.nanoTime();
    Consumer<Signal<?>> signalConsumer = new Consumer<Signal<?>>() {
      boolean first = true;

      @Override
      public void accept(Signal<?> signal) {
        // record only on first emitted element
        if (!first)
          return;
        first = false;
        registry.timer("db.latency", "controller", controller, "completed_with_error",
            String.valueOf(signal.isOnError())).record(System.nanoTime() - startTime,TimeUnit.NANOSECONDS);
      }

    };

    if (ret instanceof Mono) {
      Mono<?> mono = (Mono<?>) ret;
      return mono.doOnEach(signalConsumer);
    } else if (ret instanceof Flux) {
      Flux<?> flux = (Flux<?>) ret;
      return flux.doOnEach(signalConsumer);
    } else {
      throw new AssertionError("Unexpected return type");
    }

  }

}
To view the results an endpoint in exposed.
 private static final String DB_METRICS = "db.latency";

  @GetMapping("/db-metrics")
  Mono<String> dbMeausre() {
    return Mono.just(
        meterRegistry.get(DB_METRICS).timers().stream()
            .map(timer ->
                String.join(",", timer.getId().getTags().stream().map(Tag::getValue).collect(Collectors.joining(",")),
                    String.valueOf(timer.count()),
                    String.format("%.2f",timer.mean(TimeUnit.MILLISECONDS))))
            .collect(Collectors.joining("\n")));
  }
This is the result after hitting the endpoints of a sample app
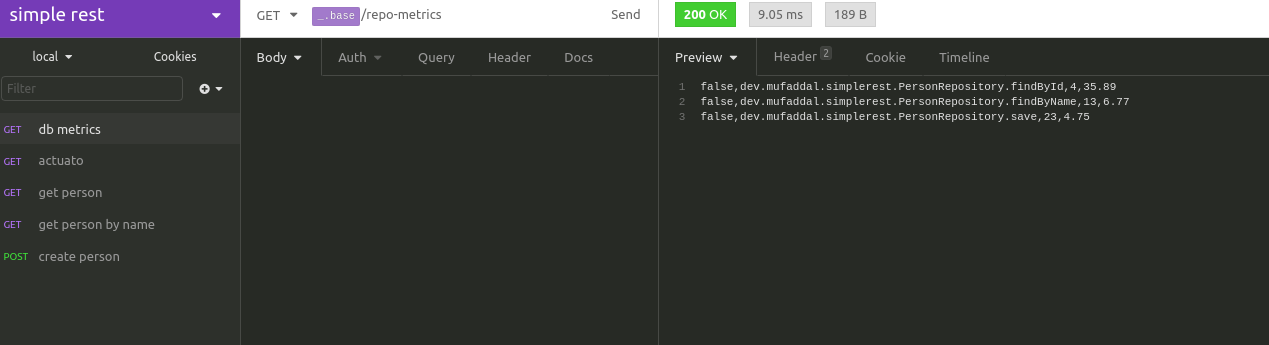
Here is the legend for the the above set of CSV
[error, fully_qualified_method_name, frequency, latency]
The error tag if, true, means that the metric records streams which signalled an error.
How to leverage this ?
Now that we have the metrics, how does one make the most of it? Our use-case is it to know the DB call frequency and average latency of the DB call whenever a business endpoint is hit in isolation. This makes it very easy to benchmark API’s in terms of DB calls and accordingly we take steps to either optimize the query (we haven’t done so yet) or reduce the no. of calls by reusing data where possible. This has really improved our turn around times when it comes to API optimization as it takes away the strenuous and error prone process of manually sifting through code to determine DB related metrics. Even our APM platform didn’t provide these metrics (it provided metrics similar to my first attempt which didn’t prove to be that useful).
This implementation can be extended to non-reactive and other DB implementations very easily by using a more general interface like Repository<T,ID> which all Spring repositories implement. Hope you found this as useful as I did. Thats all folks !